
Did Great Flood Send Denham Springs Livingston Parish Home Prices Lower?
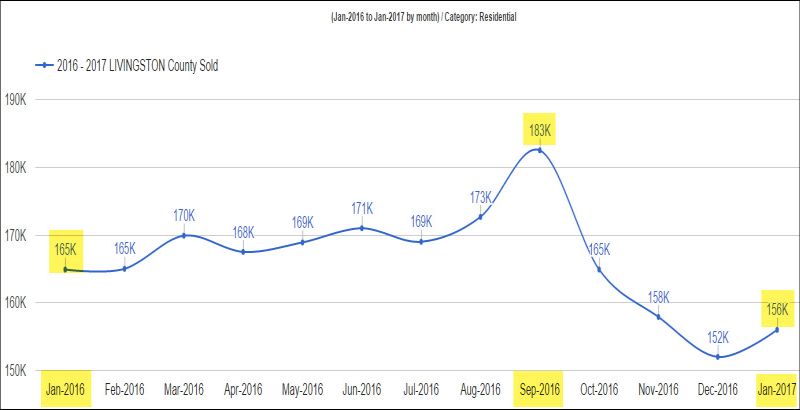
Absolutely…initially! As median sales price chart below illustrates, prices have declined from $165,000 to $156,000 since January 1 2016 because of the $25,000 to $125,000 sales prices of flooded damaged homes. However…see below
HOWEVER, sales prices of flooded-renovated Western Livingston Parish homes would blow your mind. It’s as if today’s post-flood home buyers don’t have any context as to what homes were worth pre-flood…and some of the problems inside subdivisions like Shadow Springs. This is in part due to low inventory, not enough homes available to purchase, and lack of homes or apartments available to rent. This is driving buyers to desparation and some are OVER PAYING for local housing.
Of the 15 GBRAR MLS sales so far, 11 have sold on average for $13.45 per sq. ft. MORE than pre-sold prices and 4 have sold on average for $6.25 per sq. ft. LESS than pre-sold subdivision prices. This means so far, 73 percent of sales have been positive and above pre-flood prices.
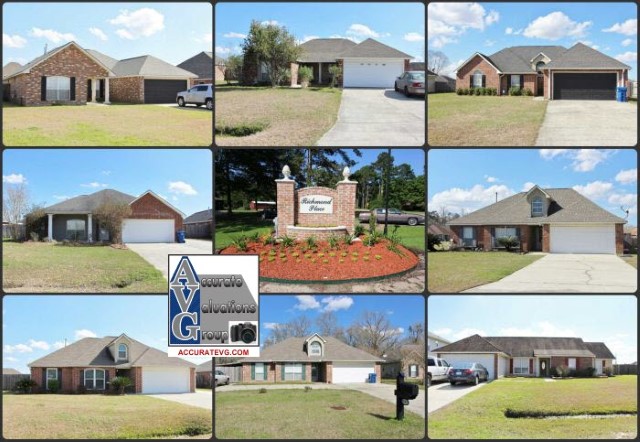
Another example is what’s taking place in Richmond Place Subdivision where home sales prices are UP!
Are Watson home values higher after the flood? At least in Richmond Place where it did not flood and those subdivisions competing with Richmond Place style and quality homes, they are higher. With low inventory, the 1998sf Evangeline Meridian PCC plan is listed at $189,900 with 2 pendings. There’s sort of this debate on Facebook about whether home prices are up post flood. To some extent they are, but this isn’t the same run up as the post Katrina market either. In this example comparing median sales price of $164,000 to current $175,950, that’s an increase of 7.2%.
Have ALL Watson homes increased 7.2% since 12 months ago?
I don’t know as it wouldn’t be a fair comparison to compare non-flooded subdivisions with flooded subdivisions. Only time and recovery will determine where prices go from here…and there’s almost no flooded-repaired sales in MLS to know yet.
Here’s a chart of Livingston Parish home sales activity from 2013 to 2016 showing positive trends.
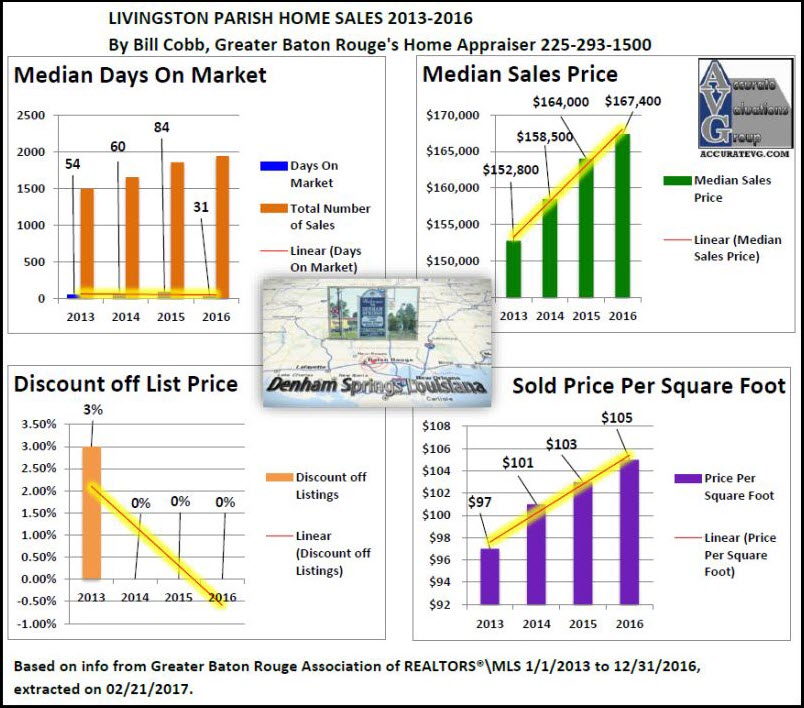
Based on infor from Greater Baton Rouge Association of REALTORS®\MLS 1/1/2013 to 12/31/2016, extracted on 02/21/2017.