South Point Denham Springs Flood Sales Update May 2017

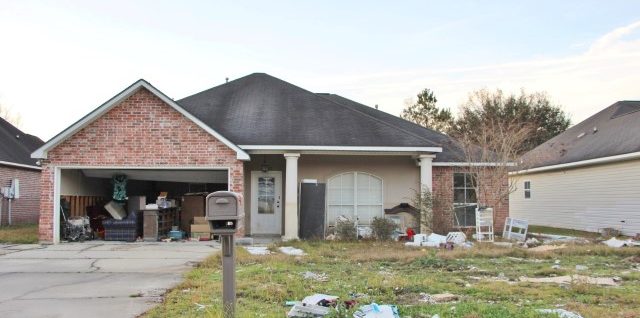
South Point Subdivision Denham Springs Post Flood Home Sales Update as of May 26 2017 South Point is being helped tremendously by the Greater Baton Rouge area’s low inventory of homes for sale. Pre-flood, the larger homes in South Point were selling in the $160s to low $170s and the flooded renovated larger homes are selling in the $180s. Other Western Livingston Parish flood updates can be found here: https://www.denhamspringsappraisers.com/category/flood-study/ Yes, approximately 35 percent of South Point did flood during the “Great Flood” of August 12-15, 2016, see flood water level in the photo below with yellow arrow pointing to Continue reading South Point Denham Springs Flood Sales Update May 2017

Livingston Parish 2016 Home Sales Stats By Subdivision Name

Livingston Parish 2016 Home Sales Stats By Subdivision Name, A Suburb of Baton Rouge. Study includes all residential sales for all types of single family properies in 2016. Study by Bill Cobb Appraiser 225-293-1500 and http://www.denhamspringsappraisers.com Overall in 2016, Livingston Parish real estate experienced a good year with lower inventory forcing increasing prices…until the Great Flood, see chart below. In November 2015, the median sales price was $163,000 which peaked in August at $184,000 only the slide down to $155,000 in November 2016. I believe this correction in home prices could last longer than surrounding Parishes because Livingston was so Continue reading Livingston Parish 2016 Home Sales Stats By Subdivision Name

South Point Denham Springs Home Sales Trends 2016

Western Livingston Parish Home Appraiser Bill Cobb recently performed research within South Point Subdivision Denham Springs and discovered these housing trends. See also chart below where I show just difference in how much lower South Point homes sell for in comparison to Livingston Trace, Westminster Estates and Woodland Crossing. While South Point sells for a median sales price of $88/sf and $145,500, Livingston Trace sells for $91/sf and $164,000, Westminster Estates $90/sf and $171,000 and Woodland Crossing $96/sf and $153,700.   June 2015 to June 2016 South Point Home Sales Trends48 Sales from $93,000 to $196,500 Median Sales Price $145,500 Continue reading South Point Denham Springs Home Sales Trends 2016

South Point Subdivision Denham Springs Housing Stats Through September 6, 2012

South Point Subdivision Denham Springs Housing Stats Through September 6, 2012. South Point Subdivision home sales are shown visually below. 2012 Median Sold Price has been $130,500, average sold price $82.51/sf and average days on the market 133 days based on 23 total sales. Stats as of 09/06/2012   NOTE: Based on information from the Greater Baton Rouge Association of REALTORS®\MLS for the period of January 1, 2011 to September 6, 2012. This information was extracted on 09/06/2012. YES, this appraiser does have the permission of GBRMLS to use the chart above Subdivision Price Trends Report!

South Point Subdivision Sign Destroyed July 4th 2012 Photos Denham Springs Louisiana

South Point Subdivision Sign Destroyed July 4th 2012 Photos Denham Springs Louisiana by http://www.southpointappraiser.com/ This is what the entrance sign used to look like:   This was the scene I witnessed while driving down Highway 16 on July 4th at the entrance to South Point Subdivision. It appears the driver was driving out of the subdivision and ran right over the entrance sign. Why? I don’t know and I don’t know if the driver survived either as the car had been across Highway 16 in the woods before the tow truck pulled the car out.

Denham Springs South Point Subdivision Q1 2012 Home Sales Numbers

http://www.southpointappraiser.com/ – Denham Springs South Point Subdivision Q1 2012 Home Sales Numbers So far into 2012, there have been 7 GBRMLS sales in South Point, average sales price $135,286, median sales price $130,000, average sales price per sq. ft. $88.36/sf. Observations. Home sales are slower in 2012 with only 7 so far and there were 31 in 2011. The average sold price per sq. ft. is up $5.32/sf. Days on market remains the same at 125 days for 2011 and 2012.   NOTE: Based on information from the Greater Baton Rouge Association of REALTORS®\MLS for the period of January 1, Continue reading Denham Springs South Point Subdivision Q1 2012 Home Sales Numbers

Denham Springs South Point Subdivision 2011 Comprehensive Housing Report

http://www.southpointappraiser.com/ – Denham Springs South Point Subdivision 2011 Comprehensive Housing Report. South Point home sales prices declined by double digits in 2011 because close to 50% of solds were distressed in some form. Here are the South Point housing numbers from end of December 2010 to end of December 2011. Some of the data isn’t showing up because there were no sales in December 2010 or December 2011. For this reason, I’m providing the GBRMLS Stats Chart as well, which should state 32 total sales for 2011. Both the Average and Median Sales Prices plunged in 2011 with double digit Continue reading Denham Springs South Point Subdivision 2011 Comprehensive Housing Report

Where Are The 2010 Livingston Parish Foreclosures Taking Place?

Where Are The 2010 Livingston Parish Foreclosures Taking Place? Livingston Parish Fore closure Trends: 2009 2010 Foreclosure Sales Numbers! 2010 Foreclosures total 13% of sales YTD; 2009 Foreclosures totaled 9%, an increase of +2% since 2009. 7% of all Livingston MLS Listings are Foreclosures! Foreclosures are negatively impacting this market. Where Are The Foreclosures Most Concentrated? The chart below represents the number of recorded Livingston Parish REO or Foreclosure Sales within the Greater Baton Rouge MLS (Multiple Listing Service), with the exception of Manufactured Housing sales. Greater Baton Rouge MLS Areas for Livingston Parish are 80, 81, 82 and 83. Continue reading Where Are The 2010 Livingston Parish Foreclosures Taking Place?

Denham Springs South Point August 2010 Update: Number of Sales And Price Per Sq. Ft. Down!

http://www.southpointappraiser.com/ – Denham Springs South Point August 2010 Update: Number of Sales And Price Per Sq. Ft. Down! There was only 1 sale in August 2010. Sold Price Per Sq. Ft. Down $7.66/sf in 2010 or -8%. AUGUST 8/1/2010 to 8/31/2010: Only 1 GBRMLS Sale. 23944 Teakwood Dr, with 1,134sf sold for $106,500 or $94/sf. YEAR-TO-DATE SOLDS: Solds In South Point from 1/1/2010 to 8/31/2010 revealed:Average Sales Price: $147,476 Average Sold Price Per Sq. Ft.: $88.24 (Avg through 8/09 $95.90)Median Sold Price: $149,500Number of Sales: 21 Average Days On Market: 85 Low To High: $106,500 to $198,500 Number of Sold Continue reading Denham Springs South Point August 2010 Update: Number of Sales And Price Per Sq. Ft. Down!