 Livingston Parish Home Sales Q1 2012, Pending Listings Up 30%, Median Sales Price Still Down
Livingston Parish Home Sales Report April 12 2011 Through April 12 2012. While Median Sales Price Continues To Correct Downward, the number of pending listing is up 30% showing pent up buyer demand, which is Good News! Inventory is also down.
This is a Q1 2012 or First Quarter 2012 multipage study of Livingston Parish Homes Sales (All GBRMLS Areas, All Sales Price Ranges, All Ages, All Types Of Properties) and includes the detailed sales per month sheets including Median Price, # Units and Average DOM or Days On Market.
Livingston Parish Home Sales Q1 2012 Pending Listings Up 30 Percent Median Sales Price Still Down
GOOD NEWS:
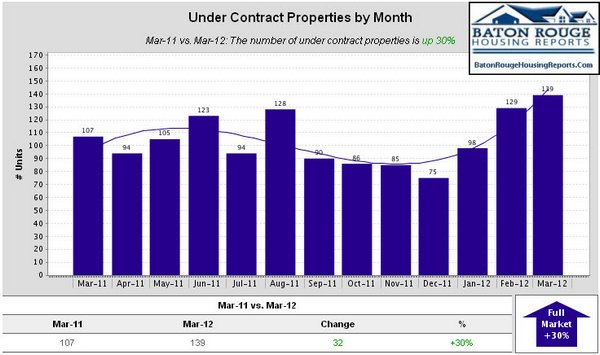
Under Contract Properties by Month
Mar-11 vs. Mar-12: The number of under contract properties is up 30%
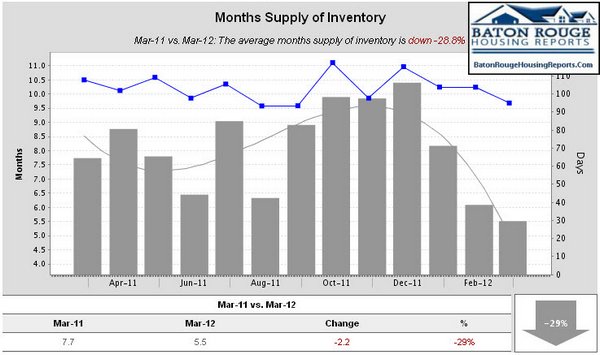
Months Supply of Inventory
Mar-11 vs. Mar-12: The average months supply of inventory is down -28.8%
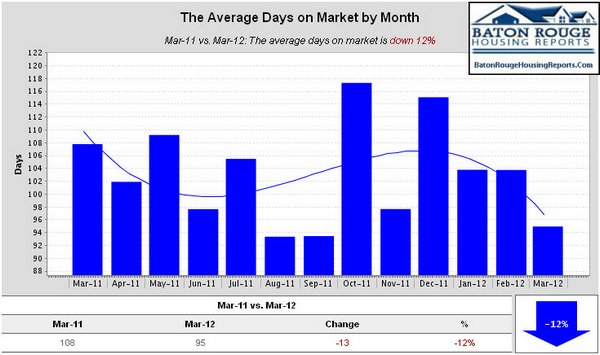
The Average Days on Market by Month
Mar-11 vs. Mar-12: The average days on market is down 12%
New Properties by Month
Mar-11 vs. Mar-12: The number of new properties is down 6%
For Sale Properties by Month
Mar-11 vs. Mar-12: The number of for sale properties is down 6%
Expired Properties by Month
Mar-11 vs. Mar-12: The number of expired properties is down 37%
BAD NEWS:
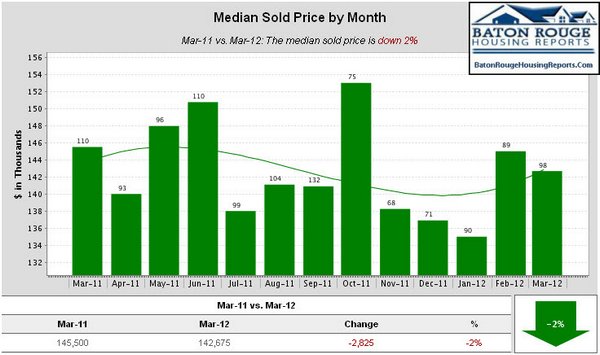
Median Sold Price by Month
Mar-11 vs. Mar-12: The median sold price is down 2%
Median For Sale vs. Median Sold
Mar-11 vs. Mar-12: The median price of for sale properties is up 3% and the median price of sold properties is down 2%
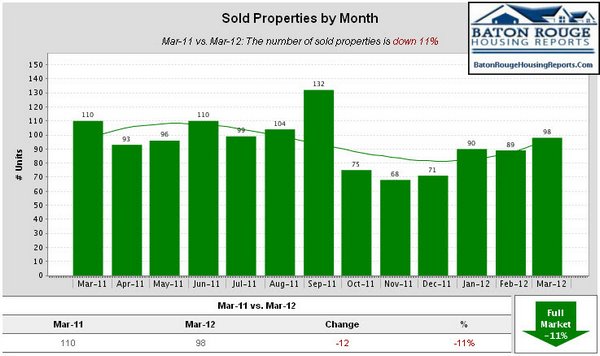
Sold Properties by Month
Mar-11 vs. Mar-12: The number of sold properties is down 11%
Supply & Demand by Month
Mar-11 vs. Mar-12: The number of for sale properties is down 6% and the number of sold properties is down 11%
WHY I REPORT MEDIAN SALES PRICE VERSUS AVERAGE SALES PRICE?
NOTE: Why Median Sales Price is a better indicator than Average Sales Price! Median Sales Price is the barometer by which the National Association of Realtors utilizes to report on national housing markets. Average Sales Price tends to take all of the home sales prices from the lowest, say $50,000, to the highest, say $1,000,000, and state the average of them all, sometimes skewing the numbers because of the extreme highs and lows. Median Sales Price tends to focus more on the middle of where the bulk of home sales prices are taking place. Generally, the Average Sales Price is going to be higher because it includes the extreme high sales prices in a given market. Fannie Mae understands the problem with using Average Sales Price and now demands home appraisers perform the 1004MC or Market Conditions form based on narrower “sub-market” parameters for comp search. This means that on a 2,000sf home, appraisers would be searching for comps with say 200sf below and above 2,000sf, say 1,800sf up to 2,200sf with similar ages and other similar characteristics.
NOTE: Based on information from the Greater Baton Rouge Association of REALTORS®\MLS for the period of April 12, 2011 to April 12, 2012. This information was extracted on 04/12/2012.