
Livingston Trace Subdivision Denham Springs Home Sales Update 2013
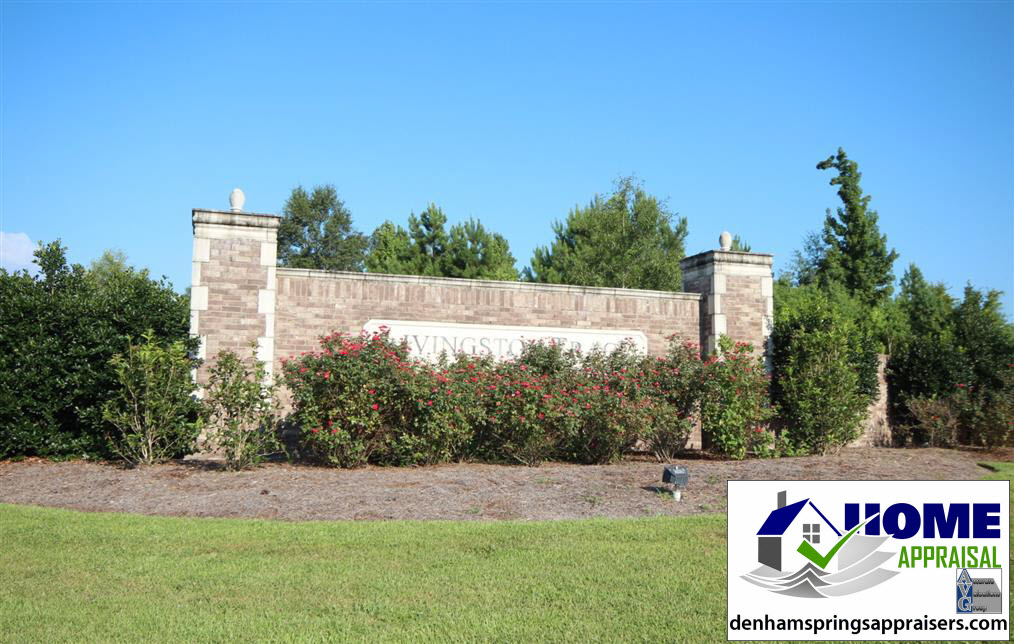
Livingston Trace Subdivision Denham Springs Home Sales Update 2013 In my opinion, in comparison to similar subdivisions like South Point, Woodland Crossing and Westminister Estates, Livingston Trace is one of the better performing subdivisions of this home quality. Median Sales Prices are $145,000 for Livingston Trace, only $132,653, $145,000 for Woodland Crossing and $150,000 for Westminister Estates. Denham Springs Neighborhood Description: Denham Springs population 10,375, 19% growth since 2000. Since mid 1990’s, rapid residential and commercial development. Draw to Western Livingston is well performing public schools and lower priced housing. Livingston is one of fastest growing Parishes in Louisiana. Location is Continue reading Livingston Trace Subdivision Denham Springs Home Sales Update 2013