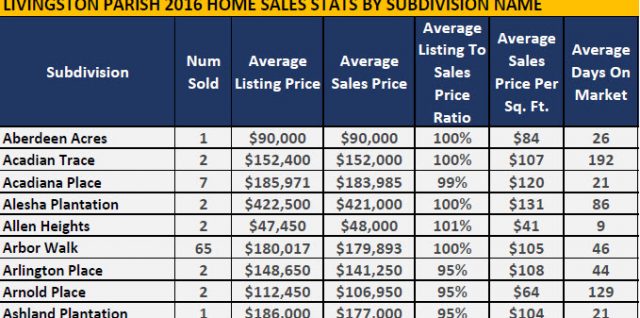
Livingston Parish Home Sales Stats 2013 to 2016
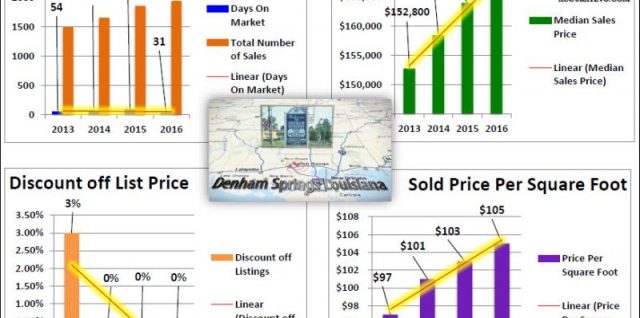
Livingston Parish Home Sales Stats 2013 to 2016 and have Livingston Parish home sales price DECLINED since the flood? Prepare for home price spikes! From 2013 to 2016, Livingstonge home sales have generally increased from 1498 in 2013 to 1947 in 2016 or 30%. The median days on market or time it takes to sell a home has declined from 54 days to 31 days. And, after the flood, flooded-renovated homes are generally selling in under 10 days. Sold price per square foot has risen from $97 in 2013 to $106 in 2016. Includes Detached Single Family, Attached Single Family Continue reading Livingston Parish Home Sales Stats 2013 to 2016