Denham Springs La Housing Trends August 2011 versus August 2012
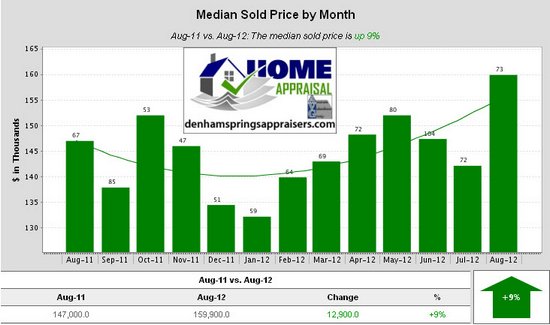
Median Sold Price by Month
Aug-11 vs. Aug-12: The median sold price is up 9%
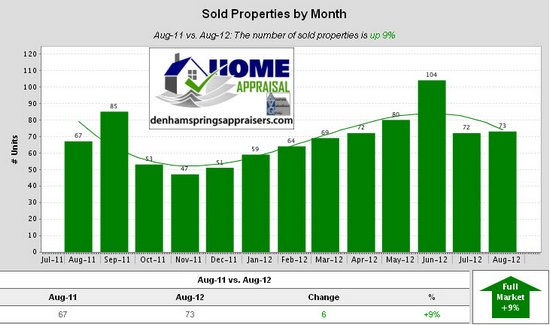
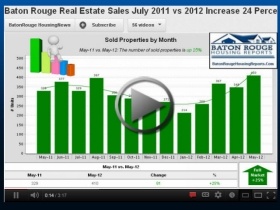
Sold Properties by Month
Aug-11 vs. Aug-12: The number of sold properties is up 9%
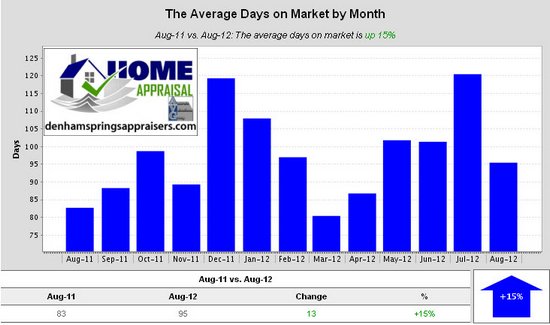
Average Days on Market by Month
Aug-11 vs. Aug-12: The average days on market is up 15%
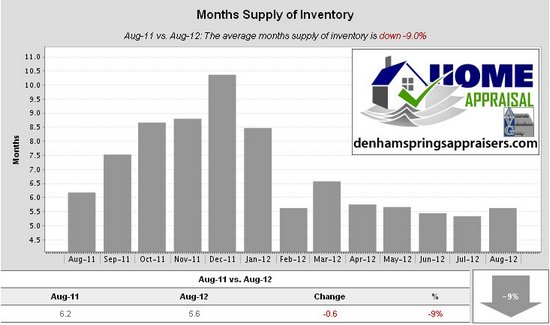
Months Supply of Inventory
Aug-11 vs. Aug-12: The average months supply of inventory is down -9.0%
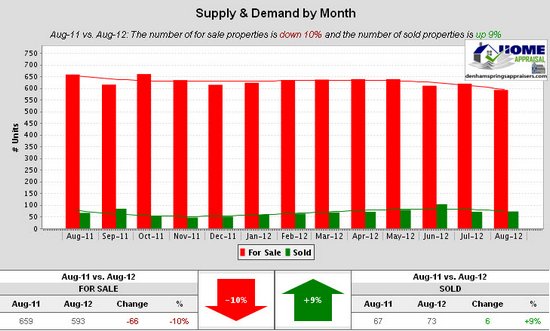
Supply & Demand by Month
Aug-11 vs. Aug-12: The number of for sale properties is down 10% and the number of sold properties is up 9%
For Sale Properties by Month
Aug-11 vs. Aug-12: The number of for sale properties is down 10%
New Properties by Month
Aug-11 vs. Aug-12: The number of new properties is down 16%
Under Contract Properties by Month
Aug-11 vs. Aug-12: The number of under contract properties has not changed
Expired Properties by Month
Aug-11 vs. Aug-12: The number of expired properties is down 32%
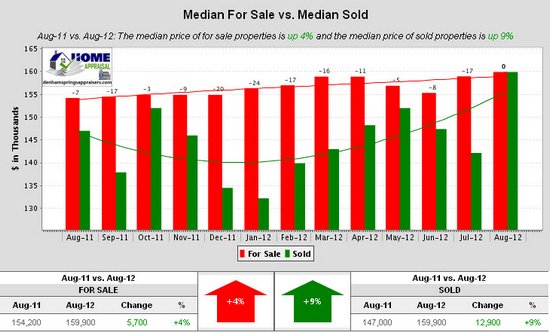
Median For Sale vs. Median Sold
Aug-11 vs. Aug-12: The median price of for sale properties is up 4% and the median price of sold properties is up 9%
View The Full 20+ page Detailed PDF of these trends here:
Brought to you by Bill Cobb Appraiser and Baton Rouge Housing Reports Monthly Market Videos
GBRAR MLS NOTE: Based on info from the Greater Baton Rouge Association of REALTORS®\MLS for the period of 08/01/2011 to 09/15/2012. This information was extracted on 09/16/2012.
Tags: Denham springs, denham springs home appraisals, denham springs home appraisers, denham springs home for sale, denham springs realtor, denham springs realtors, denham springs real estate, denham springs real estate agents, denham springs home builders, denham springs title company