Denham Springs New DSF Homes Housing Study March 2011 vs March 2012. These are ALL new homes (detached single family) in the City of Denham Spings as classified in GBRMLS, which includes 70706 and 70726.
Median Sold Price by Month
Mar-11 vs. Mar-12: The median sold price is down 3%
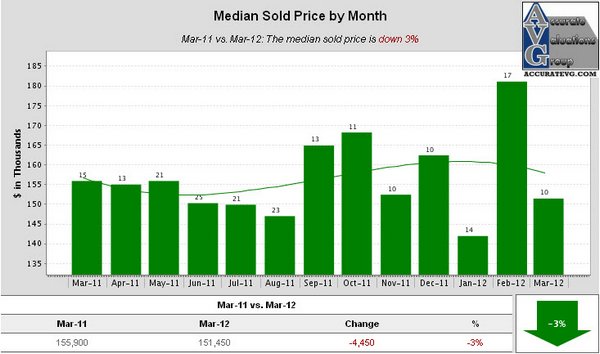
NOTE: This is contrary to what’s taking place in Willow Pointe Subdivision where sold price per sq. ft. is up $10/sf as a I reported yesterday: Willow Pointe Subdivision Q1 2012 Home Sales Numbers Denham Springs
Denham Springs New DSF Homes Housing Study March 2011 vs March 2012
Median For Sale vs. Median Sold
Mar-11 vs. Mar-12: The median price of for sale properties is up 5% and the median price of sold properties is down 3%
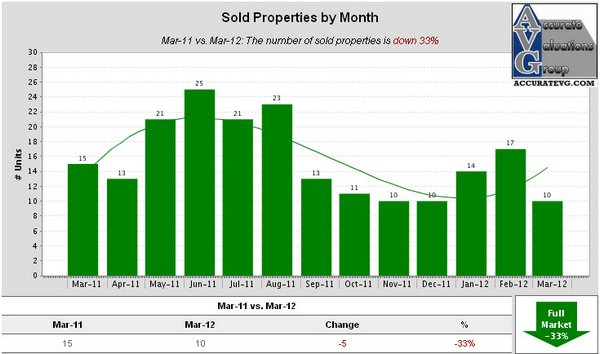
Sold Properties by Month
Mar-11 vs. Mar-12: The number of sold properties is down 33%
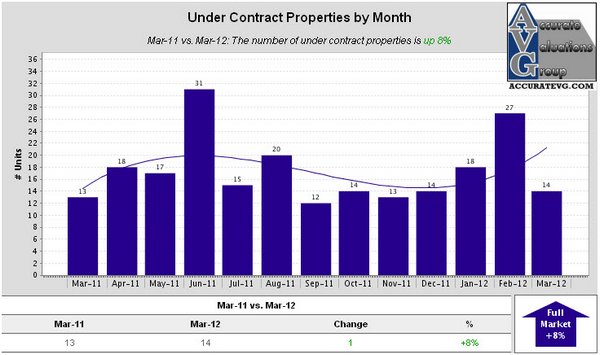
Under Contract Properties by Month
Mar-11 vs. Mar-12: The number of under contract properties is up 8%
New Properties by Month
Mar-11 vs. Mar-12: The number of new properties is down 33%
For Sale Properties by Month
Mar-11 vs. Mar-12: The number of for sale properties is up 5%
Expired Properties by Month
Mar-11 vs. Mar-12: The number of expired properties is down 80%
Supply & Demand by Month
Mar-11 vs. Mar-12: The number of for sale properties is up 5% and the number of sold properties is down 33%
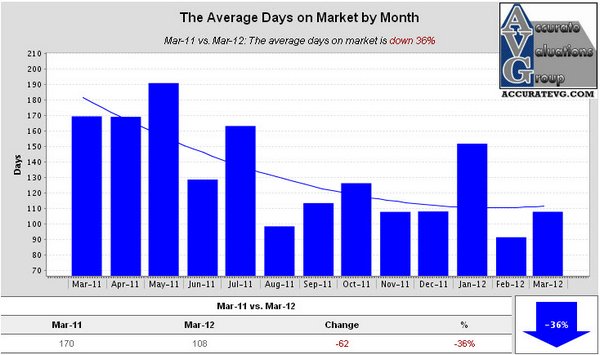
The Average Days on Market by Month
Mar-11 vs. Mar-12: The average days on market is down 36%
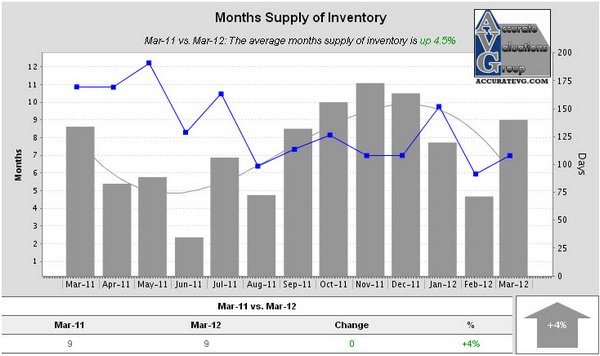
Months Supply of Inventory
Mar-11 vs. Mar-12: The average months supply of inventory is up 4.5%
NOTE: Based on information from the Greater Baton Rouge Association of REALTORS®\MLS for the period of January 1, 2011 to April 16, 2012. This information was extracted on 04/16/2012. YES, this appraiser does have the permission of GBRMLS to use the chart above Subdivision Price Trends Report!