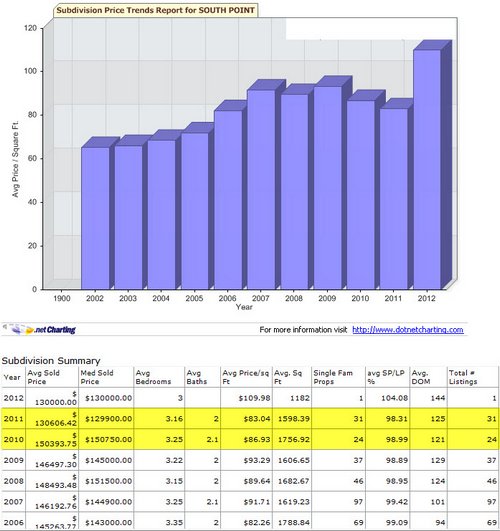
http://www.southpointappraiser.com/ – Denham Springs South Point Subdivision 2011 Comprehensive Housing Report. South Point home sales prices declined by double digits in 2011 because close to 50% of solds were distressed in some form.
Here are the South Point housing numbers from end of December 2010 to end of December 2011. Some of the data isn’t showing up because there were no sales in December 2010 or December 2011. For this reason, I’m providing the GBRMLS Stats Chart as well, which should state 32 total sales for 2011. Both the Average and Median Sales Prices plunged in 2011 with double digit declines based on “32” total home sales. Average sales price was down from $150,394 in 2010 to $130,606 in 2011 or -13%. Median sales price was down from $150,750 in 2010 to $129,900 in 2011 or -14%. I suspect part of this decline was due to 11 of the 32 total sales being foreclosures and 2 being 3rd Party Sales (relocation) and 2 short sales. This means that of the 32 total home sales, 15 were in some form of distress.
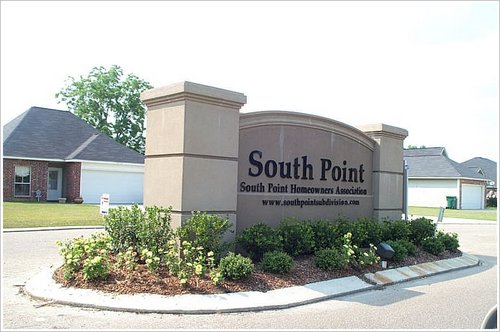
Denham Springs South Point Subdivision 2011 Comprehensive Housing Report
Dec-10 vs. Dec-11: The number of New properties is down 25%
Dec-10 vs. Dec-11: The number of For Sale properties is up 12%
Dec-10 vs. Dec-11: The number of Expired properties is down 20%
Dec-10 vs. Dec-11: The number of for sale properties is up 12% and the percent change in the number of sold properties is up 50%
Denham Springs South Point Subdivision 2011 Comprehensive Housing Report. NOTE: Based on information from the Greater Baton Rouge Association of REALTORS®\MLS for the period of 01/16/2011 to 01/16/2012. This information was extracted on 01/16/2012.