 http://www.homeappraisalsbatonrouge.com/ – Greater Baton Rouge Housing Trends For January 2011 Residential Sales Update!
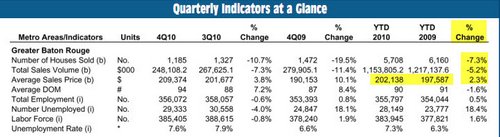
Ok, we know from the recent LREC release that in all of 2010, the number of home sale was down -7.3%. Total home sales volume was down -5.2%. And, that the “Average Sales Price”, which I am not a fan of reporting on, rose 2.3% from $197,587 in 2009 to $202,138 in 2010. To find out why I’m not a fan of using Average Sales Price, see this explanation under “AVERAGE SALES PRICE IS NOT INDICATOR WHAT WE SHOULD BE RELYING ON! .
WHAT INDICATIONS CAN WE DRAW FROM JANUARY 2011 NUMBERS? So, with 2010 being a down year for the number of home sales, how did January 2011 perform to give us an indication of what 2011 might result in?
On Facebook in 2011, there’s been a lot of positive comments from local Agents about the uptick in Agent showings and buyer interest. Is that translating into actual increase in the number of home sales?


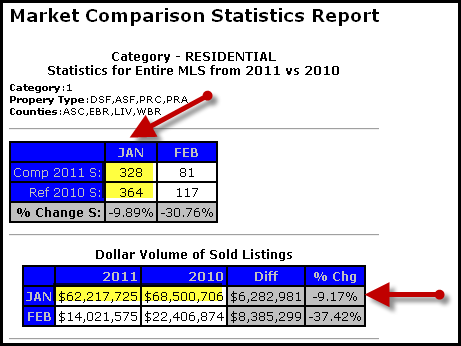
 Number Of Home Sales Down 9%. January home sales were down 9% from 2010 with 328 total sales recorded for the first month of the year versus 360 for January 2010.
No Improvement In Number Of Sales By Parish. There was no improvement in the number of home sales for ALL four local Parishes. Ascension had 73 sales in 2010 versus 72 in 2011, down 1%. East Baton Rouge had 206 sales in 2010 versus only 183 in 2011, down 11%. Livingston had 74 sales in 2010 versus 66 in 2011, down 11%. And, West Baton Rouge had 7 sales in 2010 versus 7 in 2011, unchanged.
Average Sales Price Unchanged. Average home sales prices were up 0.61% from 2010 $188,529 to $189,688 for 2011.
Median Sales Price Up 2.5%. Median home sales prices were up 2.5% from 2010 $164,850 to $168,950 for 2011.
Average Sales Price Per Sq. Ft. Down 2.3%. Average home sales prices per square foot was down 2.3% from $99.70/sf in 2010 versus $97.40 in 2011.
Days On Market Increased. Marketing time periods also increased in 2011 to an average of 103 days versus 92 days in 2010
Number of Existing Home Sales Down, Prices Up Just Slightly. Existing home sales made up 79% or 259 of the total sales recorded with an average sales price of $189,356, median sale price of $159,900. In 2010, Existing home sales made up 76% or 274 of the total sales recorded with an average sales price of $185,144 and median sale price of $159,450. So, the 2011 average sales price is up 2.3% while the median sales price was virtually unchanged.
Number of New Home Sales Down, Prices Up. New home sales made up 21% of the total sales recorded. There were 69 new homes sold in 2011 with an average sales price of $202,197 and median sales price of $179,900 versus 86 in 2010 with and average sales price of $199,313 and median sales price of $176,598.
Number of Foreclosure Sales Up 15%, Prices Down! Bank sales were up 15% from the prior year and average bank sales prices were up 21%. Average REO Sales Prices in 2010 were $113,265 versus only $106,247 in 2011. There were 60 “REO” sales in 2011 versus 52 in 2010.
NOTE: Based on information from the Greater Baton Rouge Association of REALTORS®\MLS for the period of January 1, 2010 to January 1, 2011. This information was extracted on 02/11/2011. Source For Quarterly Indicators chart is LREC.
Search Parameters were Ascension, Livingston, East Baton Rouge and West Baton Rouge Parishes, All property types except Manufactured Housing and All ages.
Tags: Ascension Parish Real Estate, Baton Rouge FHA Appraisers, Baton Rouge Home Appraisers, Baton Rouge Homes, Baton Rouge Housing, Baton Rouge Housing Market, Baton Rouge Real Estate, Baton Rouge Real Estate Agents, Baton Rouge Real Estate Housing, Baton Rouge Real Estate Trends, Livingston Parish Real Estate, West Baton Rouge Parish