http://www.batonrougemarketmetrics.com/ – Greater Baton Rouge Housing Trends: Indepth Look At 2010 Home Sales Numbers

The LREC or Louisiana REALTORS are reporting on comprehensive housing numbers for 2010, including 4th quarter 2010. So, the source for this report and charts and graphs is LREC.
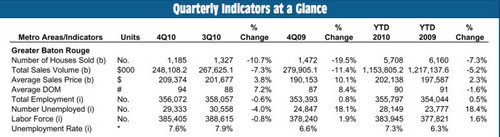
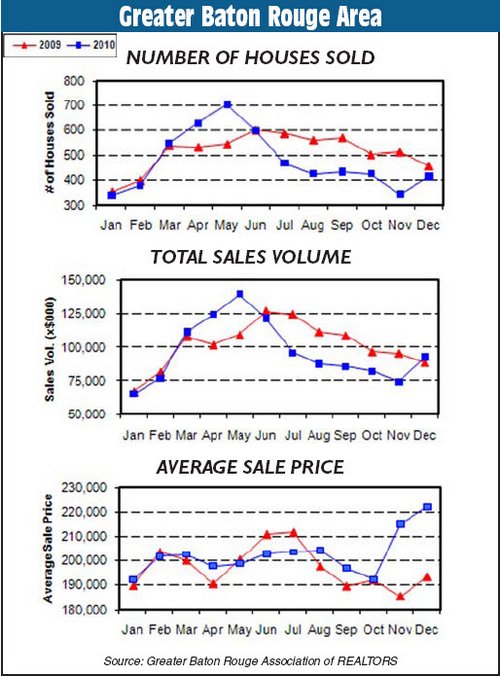
NUMBER OF SALES DOWN 7.3%. Overall, the number of Greater Baton Rouge Home Sales was down 7.3% for 2010. Total volume for 2010 was 5,708 versus 6,160 for 2009.
AVERAGE SALES PRICE. The average home sales price increased in 2010 to $202,138 vs $197,587 for 2009. This would appear to be due to strong local employment numbers of 355,797 in 2010 versus 354,044 in 2009. However, the Baton Rouge Business Report just reported this morning that “B.R. home price index drops for fifth month running“. So, according to the CoreLogic Home Price Index for Louisiana, Baton Rouge home prices are continuing to correct to the downside, not the upside, and I would agree. And, a look at the median sales prices would be more helpful than average sales prices since average sales prices can include homes from $10,000 up to $3,000,000 – outliers.
SOME IMPROVEMENT. Not all areas are declining though, but marketing time periods are well over 6 months. I’m appraising the 2011 St. Jude Dream Home in Prairieville and the general market of competing solds and listings is showing a rising median sales price, but very long marketing time periods of well over 6 months. Some homes in one local high end development on Highway 73 in Prairieville have been on the market since 2008 without selling.
AVERAGE DAYS ON MARKET. The average days on market remained almost unchanged at 90 days in 2010 versus 91 in 2009.